Your cart is currently empty!
4 Steps to Creating a Board Dashboard
By David Parmenter

The four steps
- Ascertain the organisations critical success factors and outcome statements
- Design measures separating those that summarise progress well that might be a Key Result Indicator
- Learn about the rules for designing informative graphs and clearer dashboards
- Design, test prototypes and implement
Finding the reporting measures to report to the Board
There is a major conflict in most organisations that have boards, as to what information is appropriate for the Board. Since the Board’s role is clearly one of governance and not of management it is, I believe, totally inappropriate to be providing the Board with KPIs. To me, KPIs are the very heart of management, used properly many of them are monitored 24/7 or at least weekly. Certainly not measures to be reported monthly or bimonthly to the Board. Thus the title of this page should ‘Creating a performance dashboard for the Board’.
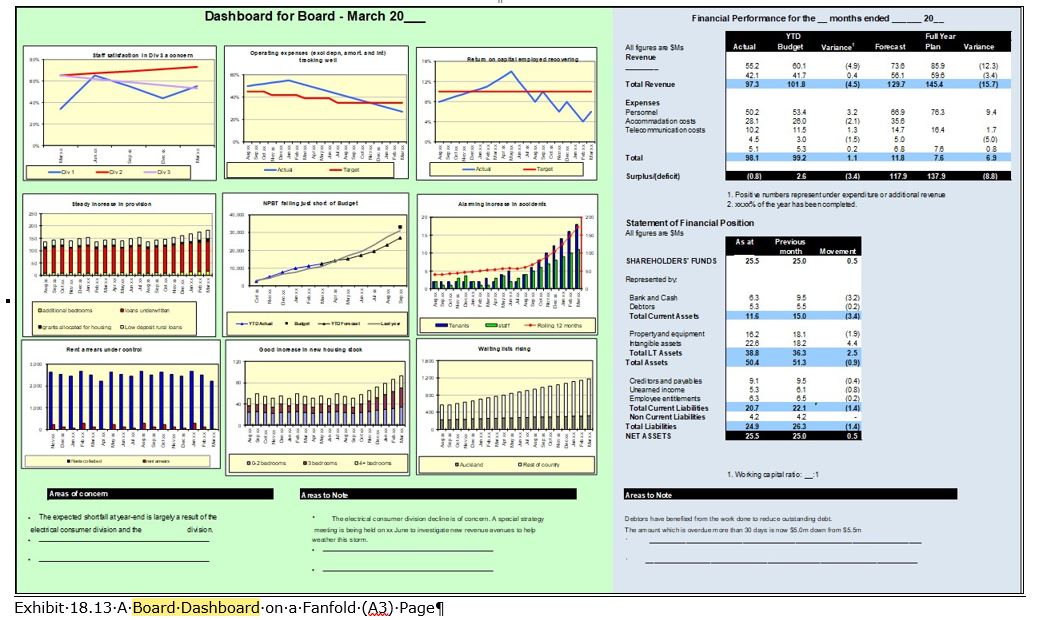
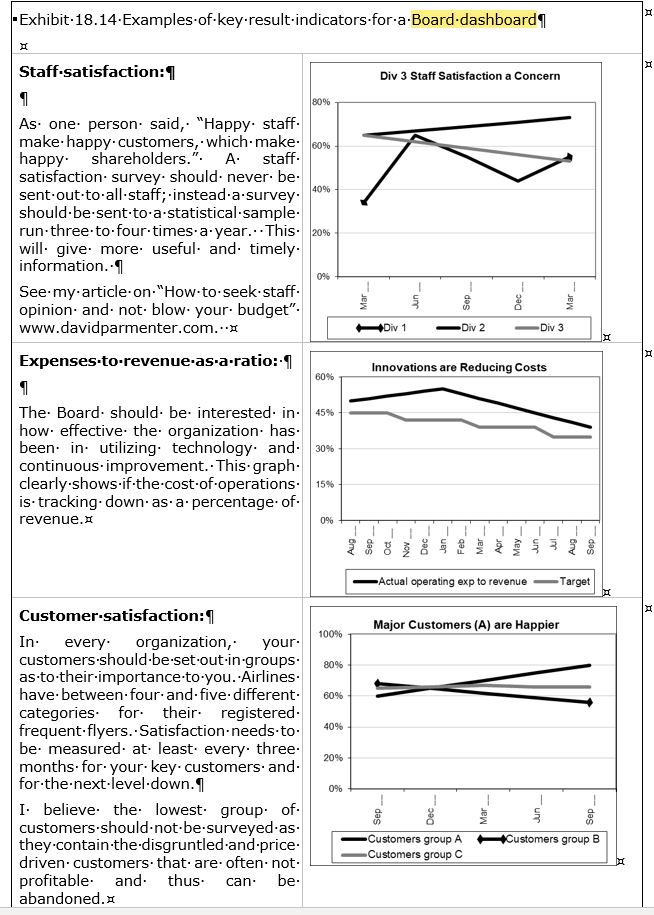
We need indicators of overall performance that need only be reviewed on a monthly or bimonthly basis. These measures need to tell the story as to whether the “liner” is being steered in the right direction at the right speed, whether the customers and staff are happy, and that we are acting in a responsible way by being environmentally friendly.
These measures are called, in my terminology, key result indicators (KRIs). Typically, a Board would need to see between six and twelve graphs covering the critical success factors and ensuring all six BSC perspectives are covered.
See an extract of my Chapter 14 Reporting Performance measures from Key Performance Indicators 3rd edition.
Purchase my latest implementation guides which are currently on sale:
How to implement winning KPIs (180 page Whitepaper + electronic templates)
and buy the Database of Measures and Associated Success Factors 4th Edition